
TWCF Doesn’t Stand For Totally Worthless Crypto Fund
A 13-week cash flow forecast (TWCF) is a rolling, week-by-week projection of cash inflows and outflows over the next 90 days. It is the primary tool PE sponsors use to monitor portfolio company liquidity, and the standard format lenders require during covenant monitoring and restructuring. Most PE-backed CFOs build theirs manually in Excel. That process takes 8-16 hours per week. This guide covers what a 13-week TWCF is, why PE firms require it, how to build one from scratch in eight steps, and how to automate it so your team spends 45 minutes instead of two full days.
So, What Is a 13-Week Cash Flow Forecast?
A 13-week cash flow forecast is a rolling weekly projection of cash receipts, disbursements, and net cash position over a 13-week (90-day) horizon. Unlike annual budgets or monthly P&L statements, the TWCF focuses exclusively on actual cash movements - not accrual-based accounting - making it the gold standard for short-term liquidity management in PE-backed companies.
Why 13 Weeks?
Thirteen weeks equals one fiscal quarter. That window is short enough to forecast with reasonable accuracy and long enough to see covenant pressure, capex timing, and payroll cycles before they become crises. It also matches the reporting periods most lenders and PE sponsors use for financial oversight. For a PE-backed CFO managing a 3-5x leverage ratio, 13 weeks is the horizon where a liquidity shortfall becomes visible early enough to act - but late enough that the data inputs are concrete rather than speculative.
Who Needs It?
Three stakeholders typically require the TWCF. PE sponsors demand it weekly or bi-weekly for liquidity visibility across the portfolio. Lenders require it during covenant monitoring, restructuring, or any period where credit risk is elevated. And boards use it for quarterly planning and capital allocation discussions. According to the Association for Financial Professionals (AFP), the 13-week TWCF is the most widely used short-term cash forecasting format in leveraged finance.
13-Week TWCF vs. Rolling Forecast vs. Annual Budget
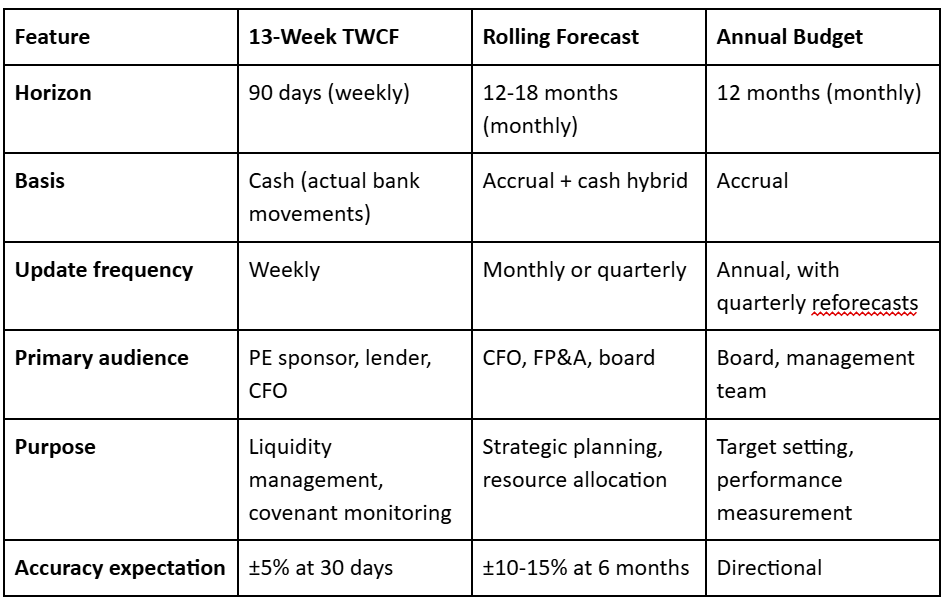
Most PE-backed companies maintain both a 13-week TWCF and a rolling 12-month forecast. The TWCF handles short-term liquidity and sponsor reporting. The rolling forecast handles strategic planning. They serve different purposes, and attempting to merge them into one model typically degrades the accuracy of both.
Why PE Sponsors Require 13-Week Cash Flow Forecasts
A PE sponsor managing a leveraged portfolio company needs to answer three questions every week: Can this company meet payroll and debt service next month? Is there a covenant breach approaching in the next quarter? And are we burning more cash than planned post-acquisition? The 13-week TWCF is the answer to all three.
The Reporting Cadence
Sponsor reporting frequency depends on the company’s risk profile. Distressed or early-stage portfolio companies - those within the first 12 months post-LBO or with tight covenant headroom - typically submit a TWCF weekly. Standard-performing companies submit bi-weekly. In either case, the weekly TWCF discussion is often the highest-stakes call a PE-backed CFO has. Miss a signal, and the next conversation involves the lender.
What Sponsors Actually Look At
PE operating partners don’t read every line of your TWCF. They focus on four things: net change in cash week-over-week, receipts vs. prior week (is the trend improving or deteriorating?), timing of large disbursements (debt service, rent, payroll, capex), and revolver availability relative to the drawn balance. If your TWCF doesn’t surface these four data points clearly, the sponsor will ask questions - and those questions erode confidence.
The 3 Questions Your PE Sponsor Asks When They Read Your 13-Week TWCF:
- Is the cash balance trending in the right direction - or are we bleeding?
- How much covenant headroom do we have, and is it shrinking?
- Are there any large disbursement cliffs in the next 30 days I should know about?
The Cost of a Bad TWCF
When a TWCF is inaccurate or late, the consequences compound. Sponsors lose confidence in the finance team’s command of the business. Lenders escalate monitoring - requesting daily cash reports or imposing additional reporting covenants. Board meetings shift from strategy to audit. And the CFO spends more time defending the forecast than running the business. For a PE-backed CFO, the TWCF isn’t just a reporting requirement. It’s a credibility instrument.
The 5 Components of a 13-Week Cash Flow Forecast
Every properly constructed TWCF contains five sections. Getting the structure right matters - PE sponsors and lenders expect a consistent format they can compare across portfolio companies and reporting periods.
- Opening cash balance - Actual cash on hand at the start of each week. This must be pulled from bank data, not from the accounting system. The difference matters: checks in transit, ACH timing, and float mean your ERP balance can differ from your actual bank balance by $500K or more on any given day.
- Cash receipts - Customer collections (broken out by aging bucket), recurring revenue, intercompany transfers in, asset sale proceeds, and any other cash inflows. The receipts section is the most judgment-intensive part of the TWCF because it requires assumptions about collection timing.
- Cash disbursements - Payroll, rent and lease payments, vendor payments (AP by due date), debt service, tax payments, capex commitments, and intercompany transfers out. Most disbursements are more predictable than receipts because they’re contractual.
- Net cash flow - Receipts minus disbursements for the week. This is the number that tells you whether cash is building or draining.
- Closing cash balance - Opening balance plus net cash flow. This is the number the PE sponsor tracks week over week - and the number that determines whether you’re approaching a covenant threshold.
How to Build a 13-Week Cash Flow Forecast (Step-by-Step)
Step 1: Gather Your Opening Cash Balance
Pull actual bank balances for all accounts as of the start of your forecast period. Use cleared bank balances - not book balance from your ERP. This means logging into each bank portal (or using an aggregation tool) and recording the available balance. For companies with 5-15 bank accounts across multiple entities, this step alone can take 1-2 hours manually.
Step 2: Map Your Cash Receipt Categories
Identify every source of cash inflow for each week of the 13-week horizon. The standard categories for PE-backed companies are: customer collections (segmented by aging bucket), subscription or recurring revenue, intercompany receipts from other entities in the portfolio, expected asset sale proceeds, and any insurance or legal settlement proceeds. Categorize each inflow type separately - your sponsor wants to see where the cash is coming from, not just how much.
Step 3: Map Your Cash Disbursement Categories
Identify every cash outflow by week. Standard categories: payroll (with exact dates and amounts), accounts payable by vendor due date, rent and lease payments, debt service (interest and principal, with exact payment dates from the credit agreement), tax payments, capex commitments, and intercompany transfers out. Debt service timing is critical - missing a debt payment date is an immediate Event of Default under most credit agreements.
Step 4: Build Weekly Receipts by Aging Bucket
Take your accounts receivable aging report and apply historical collection rates to each bucket. A common starting framework:
- 0-30 days outstanding: 85-95% collected within the period
- 31-60 days outstanding: 50-70% collected within the period
- 61-90 days outstanding: 25-40% collected within the period
- 90+ days outstanding: 5-15% collected within the period These rates vary significantly by industry and customer mix. A PE-backed services company with net-60 enterprise clients will have very different collection curves than a SaaS company billing monthly by credit card. Use your own historical data - at least 12 months of actual collection performance by aging bucket - to calibrate these rates. This is the most judgment-intensive step in the entire TWCF build.
Step 5: Project Disbursements from AP Aging and Contracts
Take your AP aging report and map each payable to its expected payment week based on vendor terms and payment history. Overlay known contract payments: rent, insurance premiums, subscription software, and any other recurring obligations. For debt service, use the exact payment schedule from your credit agreement - not an estimate. One mistake here can trigger a false covenant alarm or, worse, mask an approaching cash shortfall.
Step 6: Calculate Net Cash Flow and Closing Balance
For each week, sum total receipts and subtract total disbursements to get net cash flow. Closing balance equals the prior week’s closing balance plus the current week’s net cash flow. Run this calculation across all 13 weeks. Flag any week where net cash flow is negative - especially if it’s negative for two or more consecutive weeks. Consecutive negative net cash flow is the earliest signal of a liquidity problem.
Step 7: Calculate Covenant Headroom
If your credit agreement includes a minimum liquidity covenant (and most PE-backed companies’ agreements do), add a covenant headroom row at the bottom of your TWCF. Show three numbers for each week: your minimum liquidity covenant threshold, your projected closing cash balance, and the headroom (closing balance minus threshold). Flag any week where headroom drops below 20% of the threshold. This gives you 4-6 weeks of advance warning to take action - draw on the revolver, delay discretionary capex, or accelerate collections - before a breach becomes likely.
Step 8: Add Variance Tracking
After each week passes, add an actuals column next to the forecast for that week. Track forecast accuracy by category: were receipts higher or lower than projected? Which disbursement categories deviated? Industry benchmark for good TWCF accuracy: ±5% variance at 30 days and ±15% at 90 days. If your 30-day variance consistently exceeds ±10%, your collection rate assumptions or disbursement timing need recalibration.
The 3 Most Common TWCF Mistakes PE-Backed CFOs Make:
- Using ERP book balance instead of actual cleared bank balance - a discrepancy that can exceed $500K on any given day.
- Applying a single collection rate to all AR instead of segmenting by customer, aging bucket, and payment method.
- Not tracking forecast vs. actuals weekly - which means repeating the same forecasting errors every cycle without correction.
Common 13-Week TWCF Mistakes to Avoid
1. Using Accounting System Cash Instead of Bank Cash
Your ERP balance and your actual bank balance are not the same number. Checks in transit, ACH processing delays, and float create discrepancies that regularly exceed $500K for mid-market companies with multiple bank accounts. The TWCF must start from actual cleared bank balances. If your opening balance is wrong, every downstream calculation inherits the error.
2. Not Separating Operating vs. Financing Cash Flows
Debt service payments, revolver draws, and intercompany loans should be tracked separately from operating cash flows. PE sponsors want to see operating cash generation before financing activity. Mixing them together obscures whether the business is self-funding or relying on the credit facility to meet operating obligations - a distinction that directly affects covenant calculations and sponsor confidence.
3. Applying One Collection Rate to All Accounts Receivable
A net-30 SaaS contract paid by ACH and a net-60 professional services invoice paid by check have fundamentally different collection curves. Applying a blended collection rate across all AR produces a forecast that’s wrong in both directions - overestimating collections on slow-paying segments and underestimating on fast-paying ones. Segment by customer type, payment terms, and payment method.
4. Not Tracking Forecast vs. Actuals Weekly
The TWCF is a living document. Its value isn’t just the forward projection - it’s the feedback loop. If you’re not comparing each week’s forecast to actuals and adjusting your assumptions, you’re rebuilding the same inaccurate model every week. Variance tracking is non-negotiable for any TWCF that a PE sponsor takes seriously.
5. Building the TWCF in Isolation
The CFO or FP&A analyst building the TWCF rarely has direct visibility into every cash flow driver. Sales knows when large invoices are likely to be collected. AP knows which vendor payments are being held or accelerated. HR knows the exact payroll amounts by pay period. The most accurate TWCFs are built collaboratively - with inputs from sales, AP, HR, and operations - not by one person guessing at collection timing from an aging report alone.
Benchmarks: How Long Should a 13-Week TWCF Take?
These benchmarks reflect what Nilus observes across PE-backed mid-market companies with 5-20 bank accounts and $50M-$500M in revenue.
Industry benchmark: a CFO’s team should be able to update their TWCF in under one hour per week with the right tools. If the weekly update takes more than four hours, the process - not the person - needs to change. According to the AFP’s Essentials of Treasury Management, organizations that automate cash forecasting inputs report 30-50% improvements in forecast accuracy within the first quarter. If your team is spending eight hours per week on the TWCF, that’s over 400 hours per year - roughly $80,000-$150,000 in loaded finance team cost - on a single report. The question isn’t whether to automate. It’s how much that manual process is costing you every week you wait.
How to Automate Your 13-Week Cash Flow Forecast with Nilus
Nilus eliminates the manual data gathering, collection rate modeling, and variance tracking that consume 80% of TWCF build time. Here’s how it works:
- Connect your bank accounts. Nilus connects to all major US and international banks via open banking APIs (including J.P. Morgan, Bank of America, Wells Fargo, and SWIFT-connected international banks). Actual cleared balances are pulled in real time - no manual bank portal login or CSV export required.
- Connect your ERP. NetSuite, QuickBooks, Sage, and other major ERPs integrate directly. Nilus pulls AR aging, AP aging, and payroll data automatically, so your receipt and disbursement projections start from current, accurate inputs - not last week’s spreadsheet.
- Configure your collection rate model. Set collection rates by customer segment, AR aging bucket, and payment method. Nilus applies these automatically to project weekly receipts. Over time, the system calibrates these rates against actual collection data, improving accuracy each cycle without manual adjustment.
- Set your disbursement schedule. Map recurring disbursements - payroll dates, rent, debt service, insurance - to their payment dates. Nilus auto-populates these each week. Non-recurring items are flagged for manual review.
- Enable covenant headroom monitoring. Input your minimum liquidity covenant and any other financial covenants from your credit agreement. Nilus calculates and displays covenant headroom in your TWCF automatically, and alerts you when projected headroom drops below your defined threshold.
- Configure sponsor reporting. Set up automated weekly TWCF packages formatted to your PE sponsor’s preferred template. The report generates on schedule and includes variance analysis vs. prior week - ready to send without additional formatting. Result: Most PE-backed companies using Nilus update their 13-week TWCF in 30-45 minutes per week. Forecast accuracy improves by 30-60% vs. manual Excel within the first 90 days because the inputs - bank data, AR aging, AP aging - are current and connected rather than manually transcribed.
FAQs
What is a 13-week cash flow forecast?
A 13-week cash flow forecast (TWCF) is a rolling, week-by-week projection of cash inflows and outflows covering the next 90 days. It focuses on actual cash movements - not accrual accounting - making it the primary tool for liquidity management. PE sponsors typically require it weekly or bi-weekly. Lenders require it during covenant monitoring and restructuring. The AFP considers it the standard short-term cash forecasting format in leveraged finance.
Why do PE firms require a 13-week cash flow forecast?
PE sponsors use the 13-week TWCF to monitor portfolio company liquidity, identify covenant pressure before it becomes a breach, time capital investments and distributions, and assess management’s financial discipline. It’s the primary oversight tool - the weekly TWCF discussion is often the highest-stakes call a PE-backed CFO has. Sponsors who lose confidence in the TWCF escalate monitoring, which consumes more CFO time and signals risk to lenders.
How accurate should a 13-week cash flow forecast be?
Industry benchmark accuracy targets are ±5% at 30 days and ±15% at 90 days. Most manual Excel-based TWCFs fall short of this - ±15-25% at 30 days is common when collection rates aren’t segmented and bank data is manually entered. Automated forecasting with real-time bank data and calibrated collection models can improve accuracy to ±3-5% at 30 days, according to benchmarks observed across Nilus customers.
What’s the difference between a 13-week TWCF and a rolling cash flow forecast?
A 13-week TWCF has a fixed 90-day weekly horizon and focuses on actual cash movements - it’s the standard for PE sponsor and lender reporting. A rolling cash flow forecast is a broader concept where the forecast period advances over time (e.g., always showing the next 12 months), typically on a monthly basis using accrual-adjusted projections. Most PE-backed companies maintain both: the TWCF for short-term liquidity and sponsor reporting, the rolling forecast for strategic planning.
How often should you update a 13-week cash flow forecast?
PE sponsors typically require weekly or bi-weekly updates. At minimum, the TWCF should be updated weekly - rolling forward one week, incorporating actual bank data from the prior week, and updating assumptions for the new 13-week horizon. Companies with tight covenant headroom or those in distressed situations should update daily. Each update should include a variance analysis comparing the prior week’s forecast to actuals.
How do you integrate covenant compliance into your TWCF?
Add a covenant headroom row at the bottom of your TWCF showing three values for each week: your minimum liquidity covenant threshold, your projected closing cash balance, and the headroom (closing balance minus threshold). Flag any week where headroom drops below 20% of the threshold. This provides 4-6 weeks of advance warning to take preventive action - drawing on the revolver, accelerating collections, or delaying discretionary spending - before a breach becomes likely. For more detail, see our covenant compliance monitoring guide.
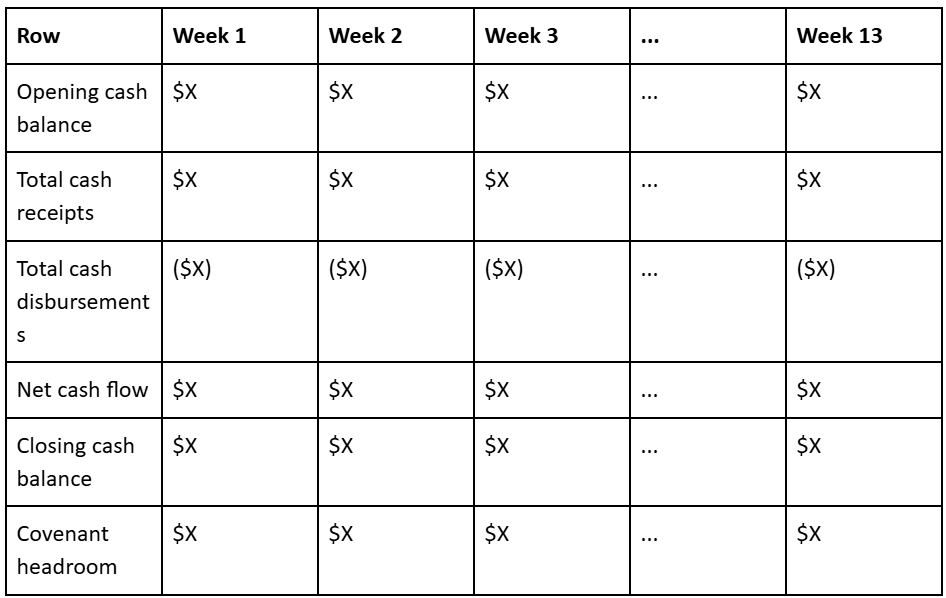
What does a 13-week cash flow forecast look like in practice?
A TWCF is structured as a matrix with rows for each cash flow category (receipts by type, disbursements by type) and 13 columns representing each week. Key rows include: opening cash balance, total receipts, total disbursements, net cash flow, closing cash balance, and covenant headroom (if applicable). After each week passes, an actuals column is added next to the original forecast to enable variance tracking. The format should be consistent week to week so the PE sponsor can identify trends without re-learning the layout.
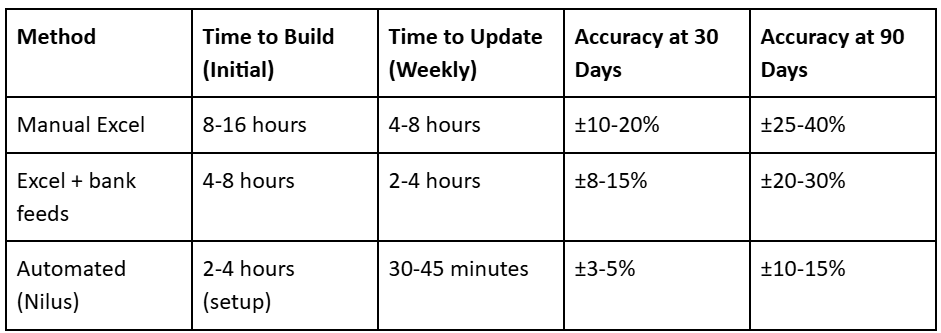
How long does building a 13-week cash flow forecast take?
Building a 13-week TWCF from scratch in Excel takes 8-16 hours for most mid-market PE-backed companies. The weekly update takes 4-8 hours manually, primarily because of bank data gathering, AR/AP aging reconciliation, and collection rate recalculation. With automated tools like Nilus, the initial setup takes 2-4 hours and the weekly update takes 30-45 minutes. Over 400 hours per year are recoverable by automating the process.