Top 10 Prompts to Turn Data Into CFO-Ready Insights (Part 2)

Introduction
In part 1, we explored five common use cases for leveraging Large Language Models (LLM) to generate CFO-ready insights, such as the ability to perform a detailed trend analysis and summarize for an executive audience.
We introduced the concept of the ROLES framework to structure prompts in a way that will generate CFO-ready insights from these LLMs, more specifically ChatGPT. We are going to use the same framework and LLM for part 2, so here is a quick reminder on the ROLES framework:
Role - Establish expertise and perspective
Objective - Define the task and desired outcome(s) clearly
Limits - Confirm scope, assumptions to make and things to avoid
Expectations - Define output format, the tone and desired sequencing
Safeguards - Confirm what to do if information is missing (avoid hallucinations)
In this article, we’ll explore five more use cases that will drive executive insights that are based upon detailed analysis, summarized at the appropriate level for the intended audience - the CFO.
6. Scenario Planning
Today, scenario planning will often mean spreadsheets, riddled with assumptions, with the goal of producing the expected outcome based upon those assumptions. More complex models can account for multiple outcomes, such as exploring the financial impact of growth at high, medium and low levels. These scenarios take time to prepare, validate, and summarize.
Now, you can use natural language prompts to generate these same insights in a matter of seconds.
Prompt
Role: In the persona of a CFO of a publicly traded SaaS company [update company industry/type as required]
Objective: Review the attached financial statements (PDF), focusing primarily on the income statement and key operational metrics. Model the impact to the financial statements for the following scenarios: (1) Revenue growth slows to 5% year over year, (2) Revenue growth remains in line with current growth rates, (3) Revenue growth increases to 20% year over year. Make reasonable assumptions for increases to direct and indirect costs, based upon current %’s of revenue.
Limits: Insights should come directly from numbers reported in the PDF. Do not infer any data not available and if the information is missing, pause and request additional inputs before attempting to provide a complete picture.
Expectations: Present the output in a short executive summary, supported with a table of results with a column for each of the 3 scenarios. The table should reference numbers and %s for verification. These numbers should include a breakdown of revenue, expenditure and profit. Share your thoughts on the likelihood of revenue growth slowing to 5% based upon historical trends.
Safeguards: List any key assumptions made prior to sharing the analysis. Do not speculate - seek additional input or ask for clarification where necessary.
Response
ChatGPT proved that LLMs are not perfect, and it took some back and forth to get an expected outcome. More specifically, for scenario 2 (revenue growth remains in line with current growth rates), ChatGPT had output projected operating income less than scenario 1 (with revenue growth at 5%). Now, of course, this is theoretically possible, but when modelling these scenarios it is generally expected that higher revenue will lead to higher operating income.
I won’t share the full dialogue here (trust me, you don’t want to read through all of it) but below are the final summarized results. I will caveat that some of the assumptions made for income tax expense are based upon historical trends and adjustments to the financial statements and this is (obviously) not representative of a true income tax expense %.

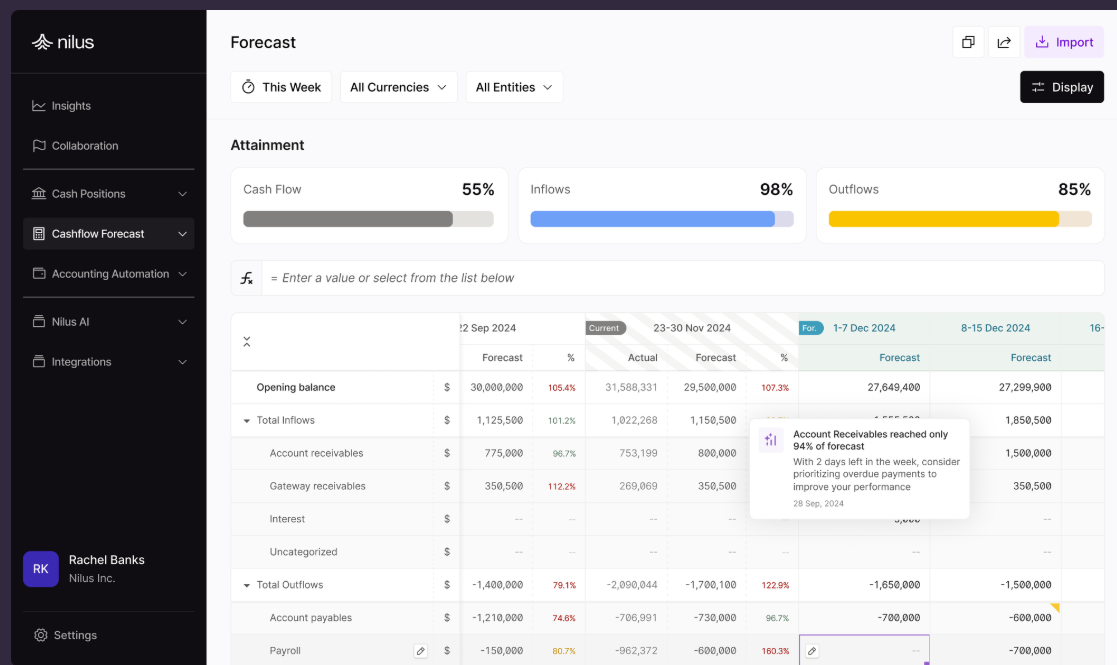
See how cash planning scenarios impact your liquidity with Nilus.

{{blog-cta}}
A more common use case for leveraging LLMs is to better understand the “why” behind variances in actuals vs forecast. One of the things I like about LLMs over human analysis is that humans are trained to seek out large variances and explain them. The LLMs can perform the same analysis across all variances in a fraction of the time. If a particular expense account shows a negligible variance, it will likely get a light human touch (or be skipped entirely). A LLM reviewing the same expense account could still analyze and verify if there were any specific transactions that skewed the numbers, which led to a minimal variance by circumstance.
Prompt
Role: In the persona of a CFO of a publicly traded SaaS company.
Objective: Create a narrative summary explaining the key reasons why operating expenses were 10% above budget in Q3. The summary should be succinct and highlight the top 5 variances (by Dollar and %) contributing to the overall 10% difference. Other meaningful variances can be called out also (e.g. any variance that exceeds 50% of budget should be flagged). For transactions that do not have an associated budget, summarize the total expense by type and who the final approver was for each transaction. To perform this analysis, first review the attached excel files. The file named “Budget vs Actual Q3” contains the budget vs actual details to reference. The file named “Transactional Data Q3” contains the detailed transactions that support actuals.
Limits: Your analysis should be confined to the data provided in the two attached files. Do not infer any data that is not available to you. If you think information is missing or you need additional information to complete your analysis, pause and request additional inputs before providing any output.
Expectations: The analysis should start with an executive summary, no longer than one paragraph. The summary should be supported with bullet points that call out the top 5 variances (by Dollar and %) for a total of 10 bullet points. Prepare an addendum that highlights other meaningful variances. Prepare a second addendum that flags transactions without an associated budget. This second addendum should include details of the underlying transactions, their value and who the final approver was for each transaction, to support follow up discussions with those approvers (if necessary).
Safeguards: When performing your analysis do not make any speculations. Seek additional clarification when required, even if that means pausing and requesting information before producing the final output. List any key assumptions made prior to sharing the final output.
Response
For the best outputs from your LLM of choice, it is best to provide a detailed transactional breakdown to support the variance analysis. Without this, the LLM can only provide surface level variance analysis. This analysis will be accurate, for sure, but will not provide the insights that leadership is looking for. With that, I have not provided a response from ChatGPT for this scenario, but we will explore more outputs in the upcoming use cases.
See how companies are leveraging tools like Nilus to easily automate variance analysis, powered by AI.
8. Benchmarking to Peers
Benchmarking is a great exercise to see how your company is measuring against industry peers. This process will often take hours of analysis and research, especially with companies not reporting their financials uniformly, so getting an apples to apples comparison is not always straightforward.
By comparing revenue and spend numbers to peers (and competitors), a business can learn where it is over or under investing in certain areas. Whether the disparity is a conscious effort or not, it is always useful to see where related companies are investing in their business and to what extent. There is always an argument to follow the herd and a counter argument to not follow the herd. It’s ok to not follow the herd, but having an awareness of what the herd is doing is useful when making decisions for your business.
Prompt
Role: In the persona of a CFO of a publicly traded SaaS company with annual revenue of $15bn and products that support a B2C model. [note we need to be even more descriptive here to benchmark against the right peer group]
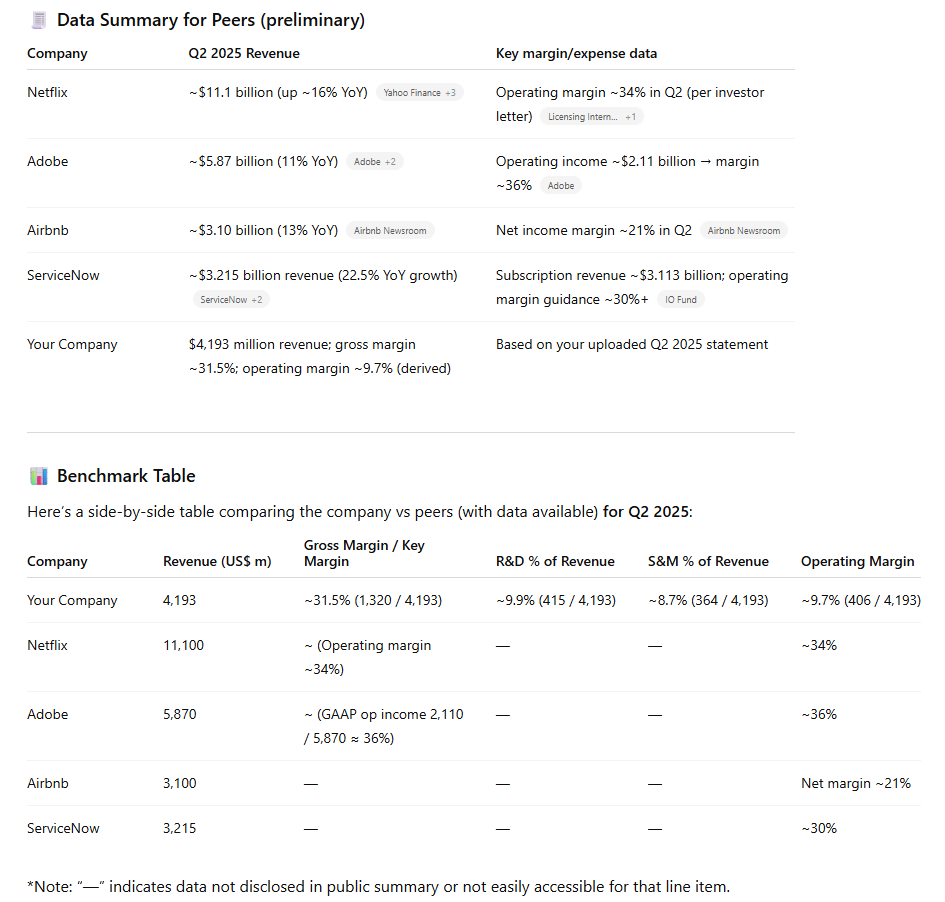
Objective: Review the attached financial statements (PDF) and compare them to the publicly available financial statements for 5 peer companies for the same accounting period. The financial statements attached include the most recent data for Q2 2025, so please benchmark against that same period. To be considered a “peer company” the company must operate in the B2C space with SaaS product offerings and have annual revenue in the range of $10bn - $25bn. Once you have sourced the publicly available data for these peer companies, compare revenue, expenditure and margins against the financial statements attached. Summarize this data in a table and share some high level bullet points on areas where we might be over- or underinvesting compared to our peers.
Limits: For the attached financial statements, do not refer to other sources of information to extract additional financial data. For the 5 peer companies, once these have been identified and validated by myself, obtain their publicly available financial statements and ensure the data you are collecting is reported for the same accounting period of Q2 2025.
Expectations: First identify the 5 peer company candidates and share those. I will then confirm if we need to change any of these before you complete further analysis. Once we have the final list of peer companies, you will prepare a summary table of the financial statement variances by comparing each peer company to the company in the attached financial statements. Below the summary table you will identify areas where this company is possibly over- or underinvesting in certain areas of the business, such as sales, marketing and research & development spend, to the extent this data is publicly available.
Safeguards: List any key assumptions made prior to sharing the analysis. Do not speculate - seek additional input or ask for clarification where necessary, especially if you cannot find publicly available financial statements for any of the identified peer companies.
Response
ChatGPT did exactly as requested and paused after providing 5 viable peer companies. It had originally proposed Salesforce as a candidate peer company, but being primarily B2C it wasn’t the right fit from a size or scope perspective. After further prompting we landed on ServiceNow, which, although primarily B2C, is within range from a revenue perspective. Netflix falls outside of range looking strictly at revenue, but they are very much a B2C company.
It did notably take longer to run this analysis compared to a more vanilla prompt, largely because I asked ChatGPT to source data for multiple companies from across the web. The time taken was negligible compared to how long it would have taken to analyze manually.

9. Liquidity Drivers
Financial statements are predominantly prepared on an accruals basis and with that cashflow statements are generally prepared on an indirect basis, making it challenging to understand key liquidity drivers for a company. Understanding how cash moves within a business is key, because profit does not equal cash. A highly profitable company can still run into liquidity challenges if not managed appropriately.
Without manually preparing a cashflow statement, we can leverage ChatGPT to provide executive level insights on liquidity drivers from our financial statements.
Prompt
Role: In the persona of a CFO of a publicly traded SaaS company.
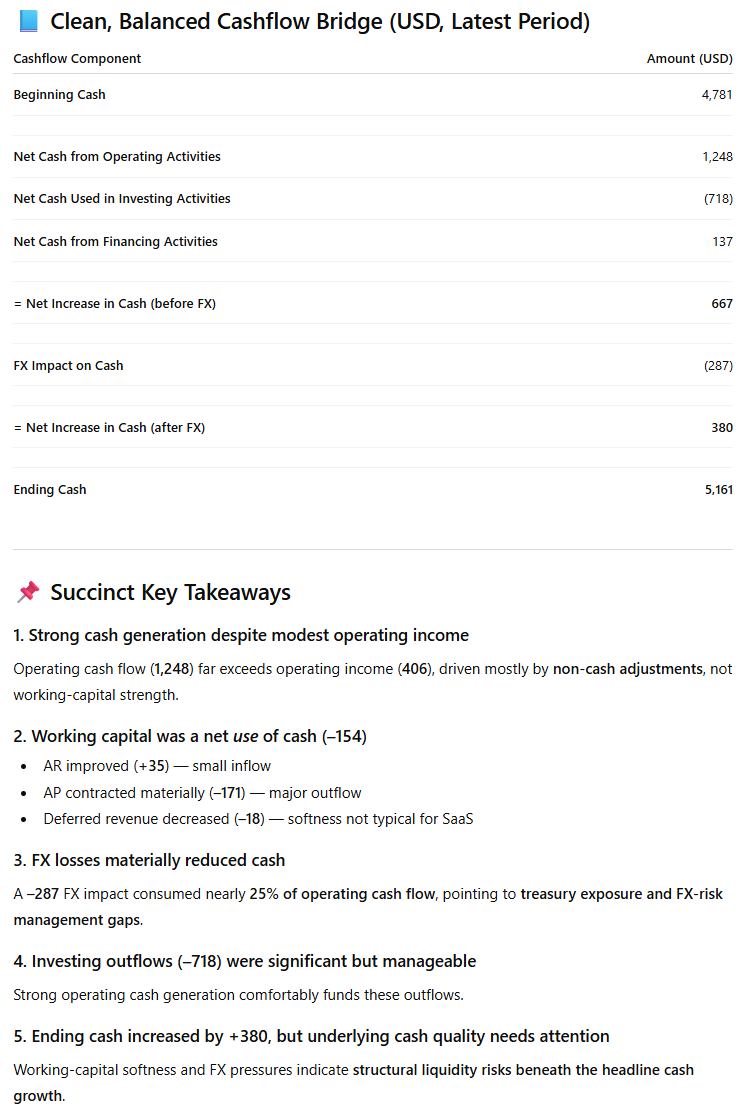
Objective: Review the attached financial statements and generate a cashflow bridge from operating income to ending cash for the latest available accounting period. Summarize the biggest inflows and outflows and highlight any working capital challenges the company should be aware of. Identify at least one actionable takeaway from this analysis that leadership should be informed on.
Limits: All insights should be derived from the numbers provided in the attached files. Do not infer any data not available in the attached files. If necessary, pause your analysis and request additional context before producing the requested output.
Expectations: First prepare the cashflow bridge in a summarized format. Call out any assumptions you made. Then capture key working capital metrics and highlight where these are in line with expectations for a publicly traded SaaS company vs out of line. Next summarize the biggest inflows and outflows of cash and call out anything out of the ordinary. Then identify at least one actionable takeaway from this analysis, presented at an executive summary level.
Safeguards: List any key assumptions made prior to sharing the analysis. Do not speculate - seek additional input or ask for clarification where necessary.
Response
This particular output from ChatGPT took a fair amount of back and forth to get it right. The initial pass had the cashflow bridge not balancing. It also produced a large analysis that was not positioned at the executive level. Here is the final output:
See how companies are leveraging tools like Nilus to receive real-time alerts for keeping liquidity optimized, powered by AI.

10. Risk and Sensitivity Analysis
Numbers are only useful if you can compare them to other numbers. While analyzing a static set of financial statements is valuable, the ability to identify the areas that are most sensitive to net income will help to better understand business risk areas and drive related business decisions.
Once we know the key variables that drive risk to net income, we plan strategies around mitigating those risks, which is especially important in times of volatility within a particular industry or at the macro level. These are the sort of insights CFOs can bring to the board of directors.
Prompt
Role: In the persona of a CFO of a publicly traded SaaS company.
Objective: Review the attached spreadsheet that contains information on revenue, cost of revenue and expenditures broken down into: Sales & Marketing, R&D, G&A and Other Expense. Convert this data into a sensitivity model that considers the impact of movements plus or minus 5-10%. Then rank the top 3 most sensitive variables to net income and explain the associated risk tied to each of these variables in an executive level summary.
Limits: Keep your analysis contained to the data provided in the attached spreadsheet. If you need clarity on a particular revenue or expense line and how it should be categorized, pause the analysis and ask for confirmation, then continue the analysis.
Expectations: Prepare a tabular analysis of the top 3 most sensitive variables to net income that reflects how you came to this determination. For each variable, explain the associated business risk and a sense for the level of sensitivity (e.g. would a very small % change have a significant impact on net income?). This is something the CFO would want to be aware of. After preparing this analysis, summarize the results in an executive level summary that highlights the key risks that can then be presented at the next board meeting for discussion. Offer any risk mitigation strategies that could be employed for the 3 specific variables identified and whether they would be appropriate for a publicly traded SaaS company.
Safeguards: List any key assumptions made prior to sharing the analysis. Do not speculate - seek additional input or ask for clarification where necessary.
Final Thoughts
As we have seen now in Parts 1 and 2, leveraging well-structured prompts can generate CFO-ready insights almost instantaneously. If your team is still spending hours on manual data analysis it’s time for them to experiment with LLMs. This doesn’t mean that LLMs are the answer to all financial analysis. In fact, while there is a strong argument to trust the immediate results, it is critcal that the analysis be verified first. Businesses should not be making decisions from raw analysis provided by ChatGPT or other LLMs for that matter. Only once the analysis has been reviewed and vetted by a Finance professional should it be leveraged to support the decision making process.
If you are still spending hours on manual analysis, it might be time to ask yourself these 10 questions. AI-first solutions are here to amplify your Finance and Treasury operations.

Written by
Your next treasury move is waiting
Get an ROI assessment, and find out where you’re leaving cash on the table.


Your next treasury move is waiting
Get an ROI assessment, and find out where you’re leaving cash on the table.
More Resources


Your next treasury move is waiting
Get an ROI assessment, and find out
where you’re leaving cash on the table.
