When you’re managing a company’s finances, the simple question “How much cash do we have today?” can feel surprisingly hard to answer. Hunting through spreadsheets, pulling reports from multiple banks, trying to reconcile payments, it’s tedious and time consuming. That’s where a cash flow dashboard changes everything. Instead of reacting after the fact, you get real-time control. You see issues before they become emergencies and you make smarter moves faster. In this post, we’ll walk you through why cash dashboards matter so much today, what separates a great one from the pack, and how to actually use one to drive smarter decisions.
Why Cash Flow Dashboards Are Critical
If you’re leading treasury or finance today, complexity is just part of the job. Multiple banks. Multiple countries. Multiple currencies. And a dozen different systems that don’t always talk to each other. Without a centralized view, answering basic questions, like available cash by region or forecasting cash shortages, becomes a nightmare. It’s not just a reporting problem. It’s a business agility problem. A cash flow dashboard acts as your financial control tower. Here’s why it’s become a must-have:**Daily Liquidity Optimization: **Imagine seeing at 9 AM that your EMEA entity is flush with cash, but APAC is about to go negative. With a dashboard, you have the insight to adjust sweeps and short-term investments the same day, not a week later when the books close. **Faster Decisions: **M&A opportunity? Emergency supplier payment? A dashboard means you spend minutes pulling up liquidity data, not hours assembling spreadsheets. **Fewer Human Errors: **We’ve all seen how one wrong formula in Excel can throw off an entire forecast. Automated dashboards pull real-time data without human work, meaning fewer opportunities for simple mistakes to become expensive problems. **Leadership and Board Alignment: **No more different versions of “the truth” floating around. Everyone, finance, the CFO, the board, sees the same real-time view. That builds trust and speeds up decision-making. In short: if you’re still managing cash via spreadsheets, you’re not just making your life harder, you’re leaving money on the table. Finance teams can spend less time explaining and more time collaborating and driving value.
What Makes an Exceptional Cash Flow Dashboard?
Not every dashboard will get you where you need to go. Some just display pretty charts without driving real action. The best dashboards work for you, surfacing insights that help you move faster and smarter. Here’s what you should look for:
1. Integration with real-time data sources
An exceptional dashboard automatically pulls data from your ERP, bank feeds, and treasury systems. Manual uploads? That’s yesterday’s game. Real-time means seeing today’s cash inflows, payment runs, and loan drawdowns without waiting for the accounting team to batch up a report.
2. Flexible Cash Position Visibility
Sometimes you need the 10,000-foot view (global liquidity).
Other times, you need to zoom in (cash by currency, account, or legal entity).
Your dashboard should be able to drill from total cash at group level to specific accounts or transactions instantly, without relying on IT or manual exports.
Summary views (e.g. total liquidity by region or business unit) and granular slices (e.g. cash by account, currency, or legal entity) should be automated and always up-to-date.
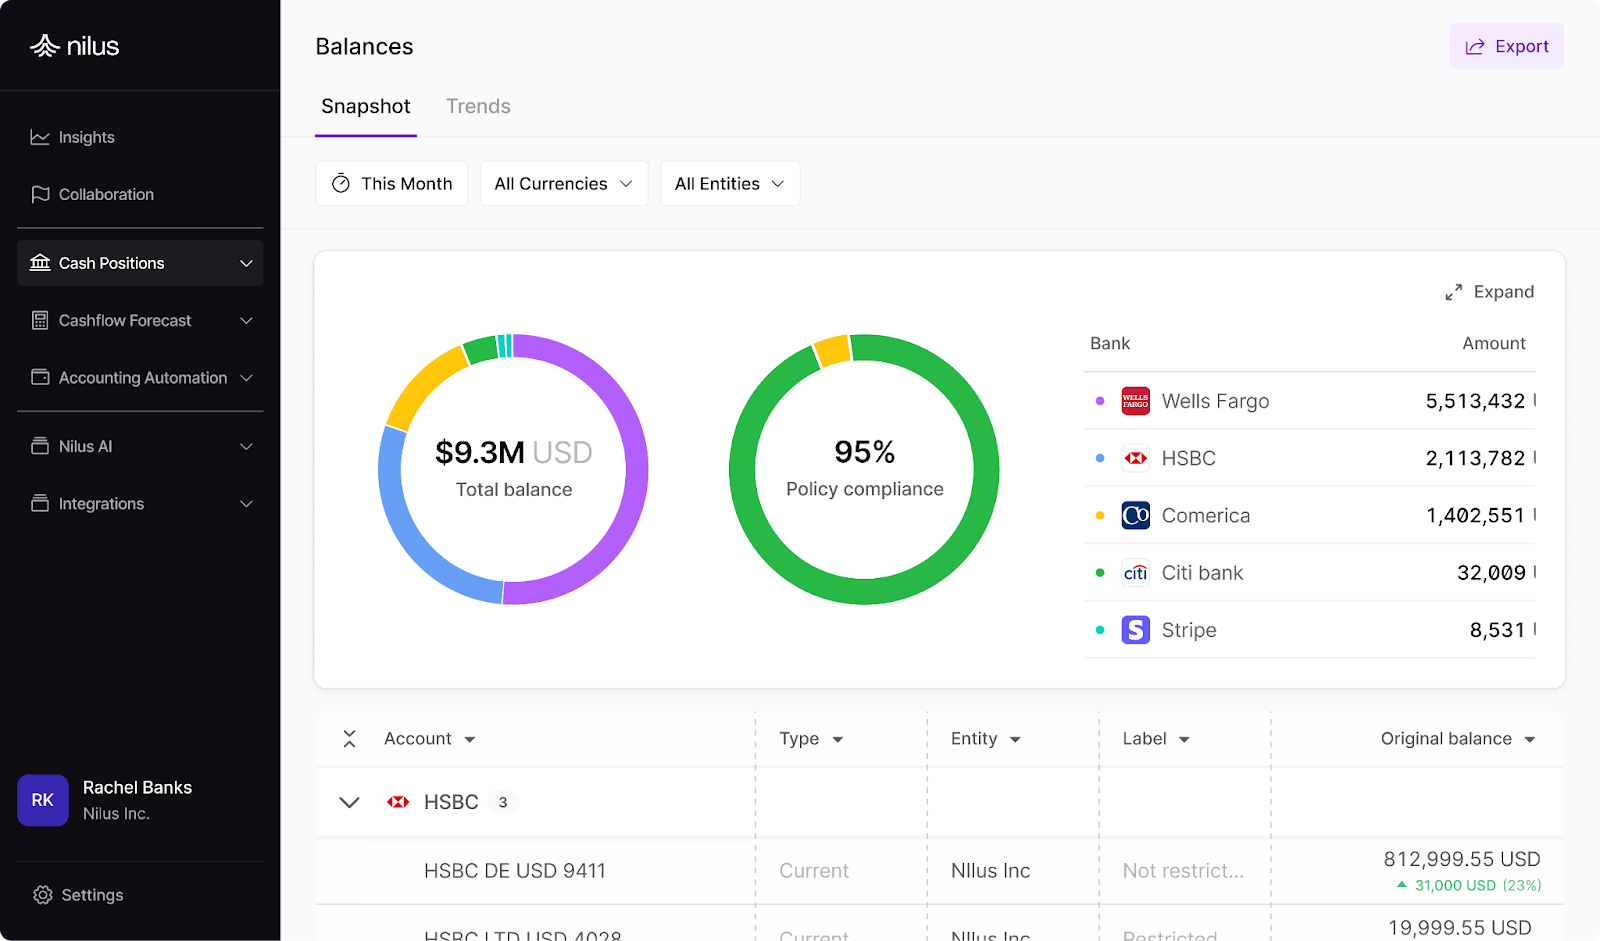 Nilus’s dashboard automatically consolidates data easy, accurate, insights
This flexibility helps you answer strategic questions quickly, without toggling through spreadsheets.
3. Actuals and Forecast
Tracking how your forecast is performing is vital, but without the right tools, it’s a time consuming process which can delay critical decisions. Your cash flow dashboard should track your actuals against your forecast in real time, making it easy to spot if collections are slower than expected or a supplier payment hit earlier than planned.
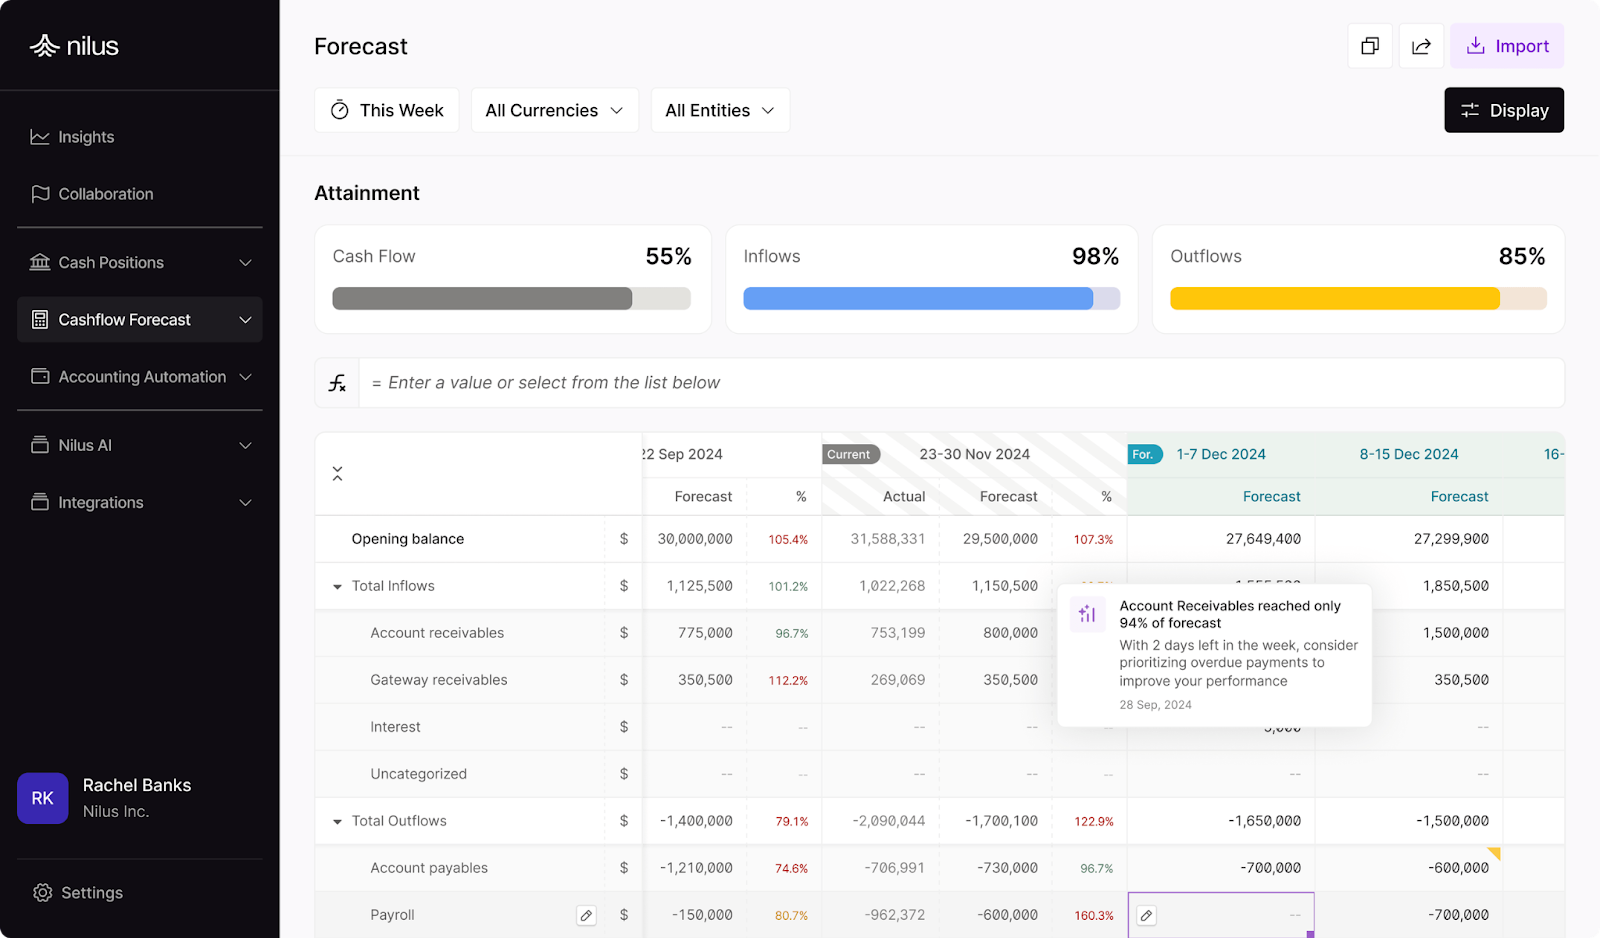 Nilus’s cash flow dashboard gives finance team real-time forecast tracking
This means less time spent in the spreadsheets categorizing transactions and more time spent making strategic, performance based, decisions.
4. AI Insights That Learn From Your Data
The best dashboards don’t just show numbers, they think with you. For example: imagine your cash outflows are creeping higher than usual for Q2. An AI-powered dashboard can flag the pattern early, helping you adjust vendor terms or defer discretionary spending. Cash flow dashboards combine all your data into one place, so they should also use their unique position to identify trends and key insights for you. Anticipating future trends should be a key function of your dashboard.
5. Real-Time Alerts
With cash, peace of mind is a tough thing to come by, but an effective dashboard can help you get closer by alerting you when something has gone wrong (or right). Cash balance dipping below a critical threshold? Unexpected surge in customer payments? A great dashboard will send you real-time alerts to make sure you can take fast action when needed and prevent cash reserves from sitting idle. Looking for some real-world examples? In our Next-Gen Finance in Action webinar, we show how modern finance teams are leveraging dynamic dashboards to lead with data.
Must-Have Metrics and Functions on a Cash Flow Dashboard
You don’t need a million KPIs. You just need the right ones that tell you whether your financial engine is running smoothly, or veering off track. Here’s what belongs front and center:
1. Cash Position (by entity or account)
This is the single most important metric. Your current, real-time, cash balance. A good dashboard should let you: Break down cash by legal entity, currency, or geography to account for internal transfer limitations and FX exposure. Monitor cash concentration to avoid idle funds and spot optimization opportunities. Quickly answer: “Do we have enough cash to cover upcoming obligations?”
2. Net Cash Flow
This is your liquidity heartbeat: the total cash inflows minus outflows over a specific time period. It’s not just a number, it’s a story. Consistent negative cash flow may indicate an operational issue or an investment-heavy phase. Spikes in positive flow might represent large one-time customer payments or asset sales. Your dashboard should allow you to filter this by time frame and entity, making it easier to isolate when and where issues (or opportunities) arise.
3. Inflow/Outflow Breakdown by Category
Viewing performance across major categories (e.g., customer payments, payroll, CAPEX) is an important function that the right dashboard can make easy. You can go broad or granular depending on the needs of your team. For example, during planning cycles, you might want high-level categories; during a liquidity crunch, you may need transaction-level detail.
4. Percentage Cash Flow Reconciliation
How accurate was your forecast compared to reality? Percentage cash flow reconciliation measures how closely your forecasted cash flow matches your actual cash flow, expressed as a percentage. It’s a simple but powerful KPI. Ideally, you want reconciliation percentages consistently close to 100%. A figure way above or below means your forecast was off. By monitoring percentage reconciliation across different periods (weekly, monthly, quarterly), finance teams can proactively refine their forecasting practices and elevate the overall credibility of their cash management reporting.
5. Cash Flow Forecast Vs. Actual
A more granular breakdown than your percentage cash flow reconciliation, this evaluates the reliability of your projections. It compares your cash flow forecast dashboard numbers to actual cash flow performance. Are you consistently overestimating vendor payments? Underestimating customer collections? Your forecast vs. actual breakdown will help you find specific areas to improve. In short: better forecast accuracy = better planning = fewer cash shocks. By focusing your cash flow dashboard on these five core metrics and functions, you not only improve day-to-day financial visibility, you also empower faster, smarter decisions. Whether it’s refining your forecast, identifying cash optimization opportunities, or flagging operational issues before they snowball, these KPIs are the pulse points of a healthy treasury operation.
Actionable Insights and Practices for Optimized Cash Flow
A dashboard isn’t just there to look pretty. Here’s how to turn insights into actions:
Set thresholds and alerts
For example: Get pinged if cash drops below 30 days of runway, or if a major receivable is 15 days overdue.
Review trends, not just snapshots
Seeing your cash burn slowly increase over three months is far more actionable than panicking after a sudden cash crunch.
Use scenario planning
Good dashboards let you model “what ifs.” What if customer payments slow by 10% next quarter? What if you delay a major CapEx spend? Ultimately, the right dashboard turns data into decisions, and decisions into value.
Take Control of Your Cash Flow Today with Nilus
An intelligent cash flow dashboard isn’t just a tool, it’s your frontline defense against financial uncertainty. With Nilus, you get a next-gen, AI-enabled cash flow forecast dashboard that helps you: Automate real-time data collection across systemsVisualize and track critical cash flow KPIsModel scenarios and improve forecast accuracyDrive better liquidity decisions, faster Ready to level up your treasury management? Book a free consultation to see how Nilus can help you build a smarter, more resilient cash management process.
The Bottom Line
When it comes to cash management, visibility isn’t optional, it’s mission-critical. A smart, well-built cash flow dashboard gives you the power to stay ahead of challenges, optimize working capital, and sleep better at night. In a world where cash is king, don’t settle for blind spots.